Global

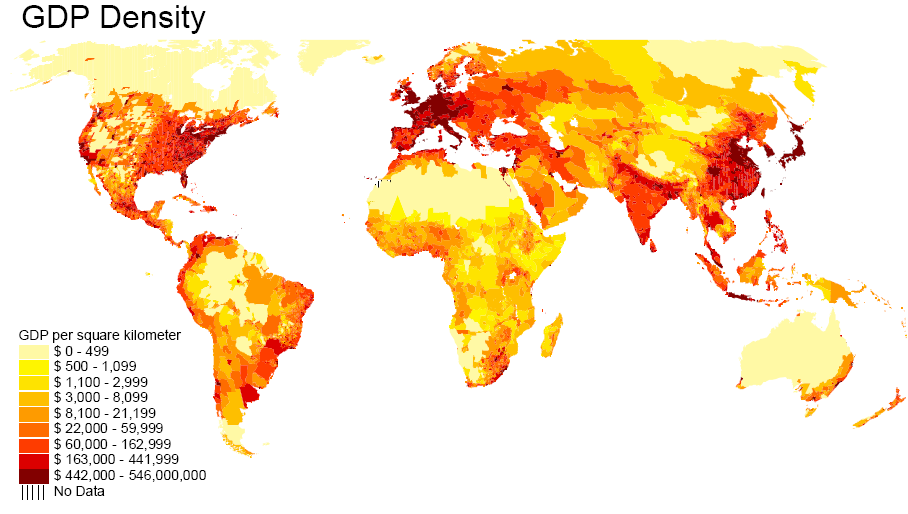
GDP density World Map

Source: 

http://www.econbrowser.com/archives/2007/01/the_distributio.html

Image: 

GDP density World Map

World Map with the density of GDP per Square Kilometer

Level: 

Image Type: 

Category: 

U.S government debt exceeds entire Euro zone and U.K combined

Source: 

http://www.google.com/imgres?um=1&hl=en&client=firefox-a&sa=N&rls=org.mozilla:en-US:official&biw=932&bih=658&tbm=isch&tbnid=Ra3080BNgHpwaM:&imgrefurl=http://www.whatamimissinghere.com/archives/41725/us-government-debt-exceeds-entire-euro-zone-and-uk-combined-graph&docid=c7eqoA-shq1RFM&imgurl=http://www.whatamimissinghere.com/wp-content/uploads/2012/04/US-Government-Debt-Exceeds-Entire-Euro-Zone-and-UK-Combined-Graph.jpg&w=500&h=363&ei=FuUiUOb_C8mriAK8wYCQDg&zoom=1

Image: 

U.S government debt exceeds entire Euro zone and U.K combined

The U.S debt topped $15 trillion in 2011; while the U.K and Euro zone's collective debt amounted to approximately $13 trillion.

Level: 

Image Type: 

Category: 

Annual economic loss from natural disasters

Source: 

http://forum.maplecroft.com/showpage?section=cartograms&topic=maplecroft_cartograms

Image: 

Annual economic loss from natural disasters


The annual economic loss from natural disasters. So we can see that USA, EEA, China and Japan are the most economically impacted. 

Level: 

Image Type: 

Category: 

Top 10 Natural disasters in 2009

Source: 

http://feww.wordpress.com/category/unisdr/

Image: 

Top 10 Natural disasters in 2009


The ten deadliest disasters are almost all located in developing country whereas USA only appears in top 10 in number of event. There are a high number of disasters in the USA, however compared to the other countries in the list, the loss is less. For example Indonesia, which had less disaster in 2009 than the USA, however, more people had been killed during these event, then in the USA. 

Level: 

Image Type: 

Category: 

Number of people killed, injured, homeless and otherwise affected by natural disasters between 1980-2005

Source: 

http://forum.maplecroft.com/showpage?section=cartograms&topic=maplecroft_cartograms

Image: 

Number of people killed, injured, homeless and otherwise affected by natural disasters between 1980-2005

the most impacted population are in India, China and Africa. It’s because of the infrastructure and prevention are less developed than USA or EEA. Asia is vusialised as such a big part also because of the high population density. 

Level: 

Image Type: 

Category: 

World map of natural catastrophes for 2010

Source: 

http://reliefweb.int/map/chad/world-map-natural-catastrophes-2010

Image: 

World map of natural catastrophes for 2010

Repartition of all the natural disasters in the world in 2010.  You can see that there is quite a high number of blue and green dots, which means hydrological as well as meteorological events. Quite a high percentage is concentrated in the eastern part of the United States. As well as in South-East Asia occur a high number of these disasters. 

Level: 

Image Type: 

Category: 

Pages