Global

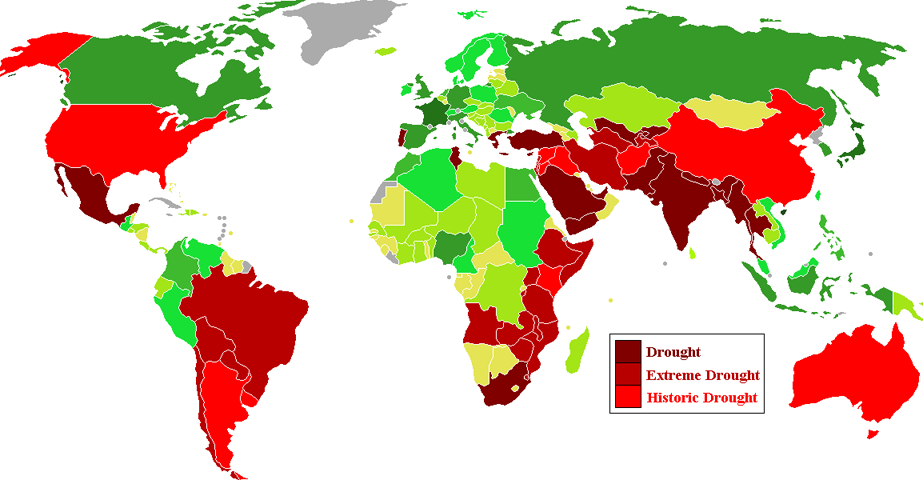
Countries on droughts, 2009

Source: 

http://www.google.com/imgres?um=1&hl=en&client=firefox-a&rls=org.mozilla:en-US:official&biw=1920&bih=973&tbm=isch&tbnid=8-OzLCi636S20M:&imgrefurl=http://www.greatdreams.com/climate/drought-2009.htm&docid=4YpFL6NvrruocM&imgurl=http://www.greatdreams.com/climate/Countries_by_agricultural_drought.png&w=923&h=480&ei=6SX7T4D3Lo61qAHpvpCPCQ&zoom=1&iact=hc&vpx=163&vpy=170&dur=3432&hovh=162&hovw=312&tx=208&ty=127&sig=117909653472347018289&page=1&tbnh=102&tbnw=197&start=0&ndsp=43&ved=1t:429,r:0,s:0,i:72

Image: 

Countries on droughts, 2009

These were the current situation in 2009. Most part of Asia, North and South America and Africa are suffering from agricultural droughts.

Level: 

Image Type: 

Category: 

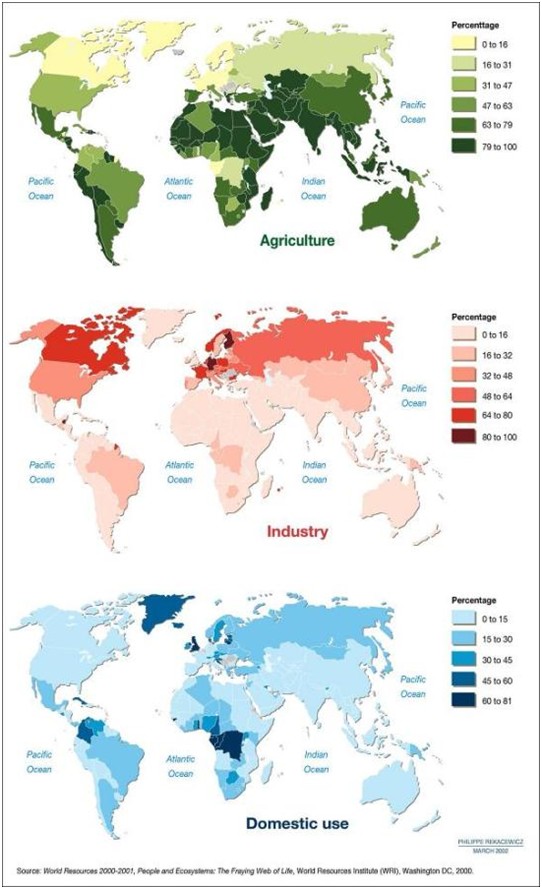
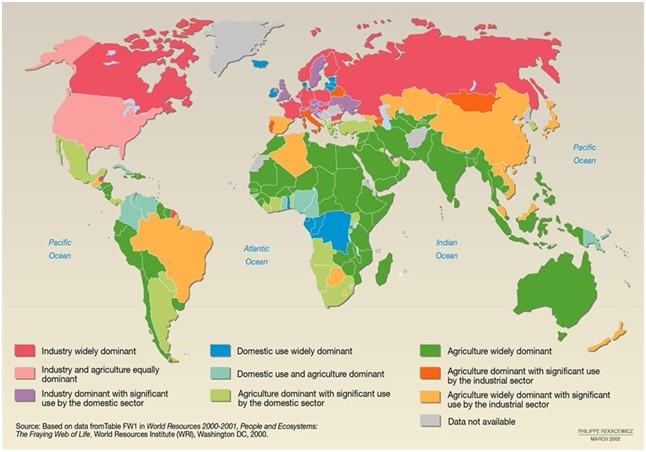
Distribution significant samples of corprate regions from the world

Source: 

http://www.assemblee-nationale.fr/13/rap-info/i4070.asp

Image: 

Distribution significant samples of corprate regions from the world

States that collect the most water are those where irrigated agriculture is very important. There are currently 280 million hectares irrigated worldwide, against 190 in 1980. Irrigated agriculture is responsible for 95% of freshwater withdrawals in some developing countries. Looking at the share of renewable resources withdrawn for agriculture, there are clear differences. In some areas, the resource is not mobilized, including where agricultural use is overwhelmingly dominant, either due to low population density or poor management of the resource.

Level: 

Image Type: 

Category: 

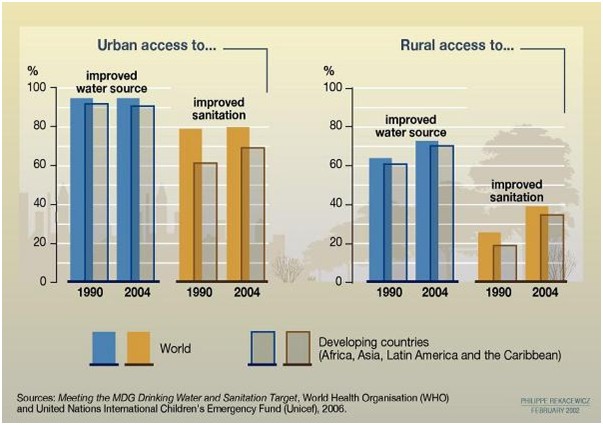
water access

Source: 

http://www.grida.no/graphic.aspx?f=series/vg-water2/0215-5-graph-regions-EN.jpg

Image: 

water access


Level: 

Image Type: 

Category: 

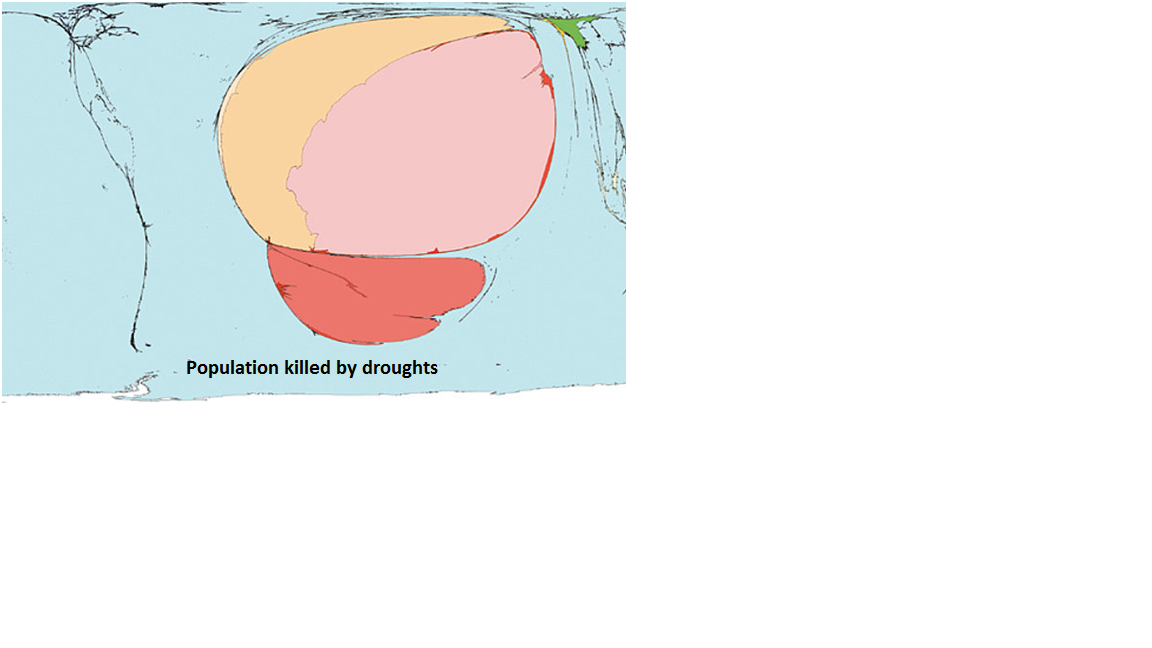
Population killed by droughts

Source: 

http://knowledge.allianz.com/health/food_water/?698/worldmapper-water-supplies

Image: 

Population killed by droughts

The size of countries displayed is in proportion with the number of people who died from droughts there between 1975 and 2005. 98% of deaths: Ethiopia, Sudan and Mozambique.

Level: 

Image Type: 

Category: 

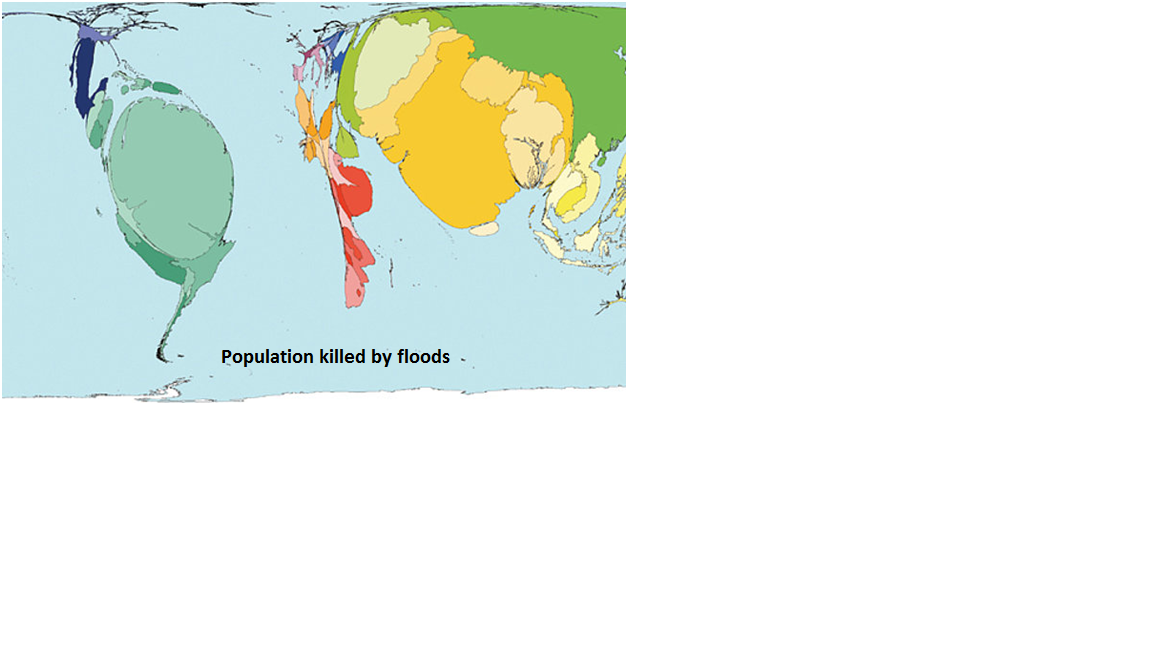
Population killed by floods

Source: 

http://knowledge.allianz.com/health/food_water/?698/worldmapper-water-supplies

Image: 

Population killed by floods

The size of countries displayed is in proportion with the number of people killed by floods between 1975 and 2005 (Venezuela biggest)

Level: 

Image Type: 

Category: 

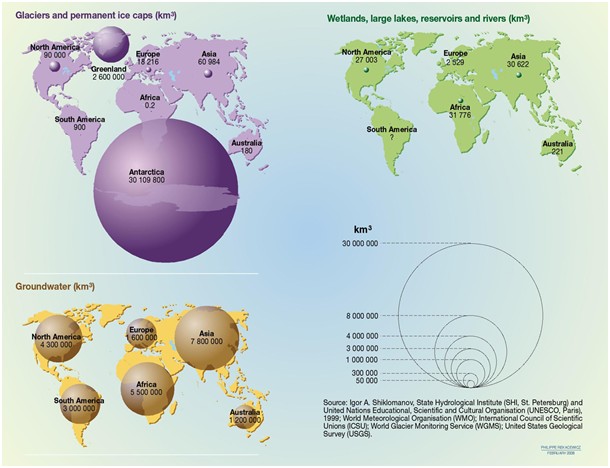
Freshwater resources: volume by continent

Source: 

http://www.visualinformation.info/wp-content/uploads/2010/03/freshwater-resources-volume-by-continent.jpg

Image: 

Freshwater resources: volume by continent


Glaciers and ice caps cover about 10% of the world’s landmass. These are concentrated in Greenland and Antarctica and contain 70% of the world’s freshwater. Unfortunately, most of these resources are located far from human habitation and are not readily accessible for human use. According to the United States Geological Survey (USGS), 96% of the world’s frozen freshwater is at the South and North Poles, with the remaining 4% spread over 550,000 km2 of glaciers and mountainous icecaps measuring about 180,000 km3 (UNEP, 1992; Untersteiner, 1975; WGMS, 1998, 2002).

Level: 

Image Type: 

Category: 

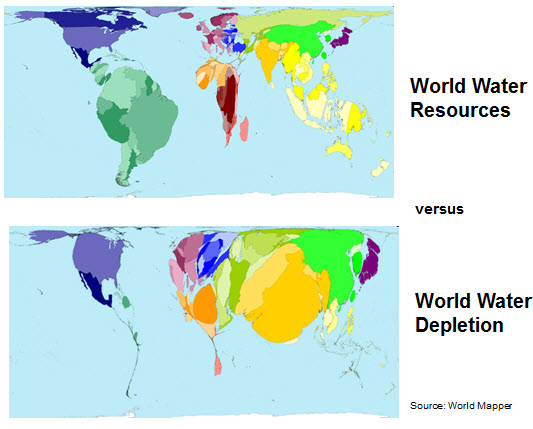
World Water Resources VS World Water Depletion

Source: 

http://www.google.com/imgres?um=1&hl=en&client=firefox-a&rls=org.mozilla:en-US:official&biw=1920&bih=973&tbm=isch&tbnid=WghlzSiigtiUvM:&imgrefurl=http://induslatin.com/2010/09/20/india%25E2%2580%2599s-water-nightmare-for-agriculture-and-why-latin-america-is-the-place-to-mitigate-that-crisis/&docid=EL5lTxqBSOYmlM&imgurl=http://induslatin.com/wp-content/uploads/2010/09/worldwaterresourcesvsdepletion.jpg&w=533&h=429&ei=jVP3T6v2KY34rAGh8r0N&zoom=1&iact=hc&vpx=1048&vpy=641&dur=798&hovh=182&hovw=226&tx=114&ty=88&sig=117909653472347018289&page=1&tbnh=147&tbnw=182&start=0&ndsp=43&ved=1t:429,r:30,s:0,i:167

Image: 

World Water Resources VS World Water Depletion

This map shows, in proportions, the quantity of water available versus the quantity of water that is disapearing on earth. \

Is we take for example India: not so much resources but huge depletion

Level: 

Image Type: 

Category: 

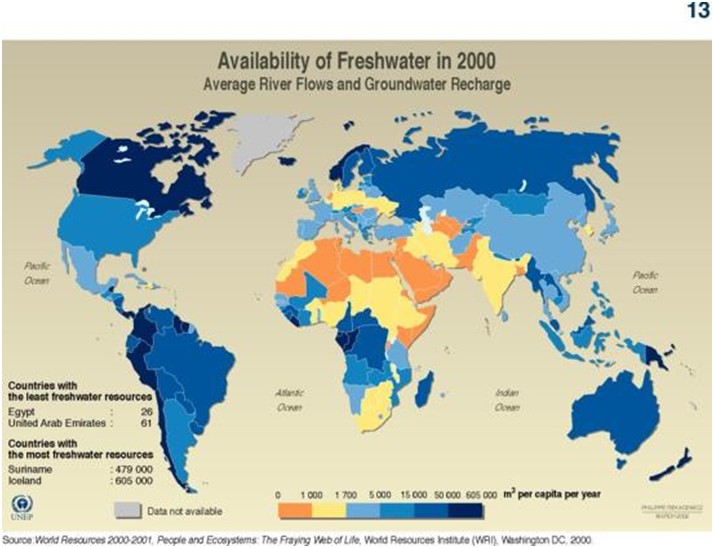
Availability of freshwater in 2000

Source: 

http://www.grida.no/graphicslib/detail/freshwater-availability-groundwater-and-river-flow_a39a#

Image: 

Availability of freshwater in 2000


This graphic shows the availability of freshwater through average river flows and groundwater recharge, in cubic metres per capita per year, at the national level in the year 2000. The graphic highlights the countries with the least freshwater resources (Egypt and the United Arab Emirates) and those with the most (Suriname and Iceland).

Level: 

Image Type: 

Category: 

real time world statistics

Source: 

http://www.worldometers.info/

Image: 

real time world statistics


Worldometers is run by an international team of developers, researchers, and volunteers with the goal of making world statistics available in a thought-provoking and time relevant format to a wide audience around the world. We have no political, governmental, or corporate affiliation

Level: 

Image Type: 

Category: 

Pages