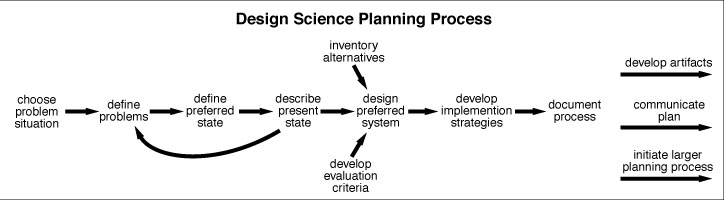
Flowchart

Water Use

Source: 

http://www.athirstyplanet.com/your_h20/our_water_cycle

Image: 

Urban Water Use and Reuse Cycle

Level: 

Image Type: 

Category: 

Systems Diagram of a City

Source: 

http://upload.wikimedia.org/wikipedia/commons/4/4e/Systems_diagram_of_a_city.png

Image: 

Systems Diagram of a City

This is an interesting "Systems Diagram of a City", found at:

http://en.wikipedia.org/wiki/File:Systems_diagram_of_a_city.png

And the image appears on the wikipedia page for Emergy, and is labelled "Energy system diagram of a city in its support region"

http://en.wikipedia.org/wiki/Emergy

This diagrams the major energy  flows in and out of a city.

Level: 

Image Type: 

Category: 

Process of an Online Transaction

Source: 

http://www.isoc-vn.org/www/archive/010922-SProbst-eCommerceIntro/sld001.html

Image: 

Process of an Online Transaction

This image displays the process of an online transaction. The image shows the flow of how a customer can purchase a product online. After, the transaction is completed when the money is withdrawed from the customer's bank into the merchant's bank. The flow chart displays the facile manner in which an electonic purchase can be made. 

Level: 

Image Type: 

Category: 

Disaster Cycle

Source: 

http://www.fig.net/pub/figpub/pub38/pub38_screen.pdf

Image: 

Disaster Cycle

The Disaster Cycle shows the steps which have to be taken after an event happened. It shows as well which steps have to be taken to be prepared for the next event.

Level: 

Image Type: 

Category: 

Pages