The EcoTipping Points ProjectSubmitted by alyssablack on Wed, 07/16/2014 - 10:55am Link: Germany- Freiburg- Green City
Unified Port of San DiegoSubmitted by alyssablack on Wed, 07/16/2014 - 10:49am Link: Port of San Diego Moves Forward with Sustainable Energy Partnership
Sunline EnergySubmitted by alyssablack on Wed, 07/16/2014 - 10:45am Link: Sunline Energy: Solar and Electric
Equinox CenterSubmitted by alyssablack on Wed, 07/16/2014 - 10:43am Link: Equinox Center Regional Dashboard
San Diego Renewable Energy SocietySubmitted by alyssablack on Wed, 07/16/2014 - 10:41am Link: San Diego Renewable Energy Society
FAMO.US in San Diego Meetup Date: 08/13/14http://www.meetup.com/Famous-in-SanDiego/Audience: PublicEvent Type: SimCenterCalendar: Master Calendar
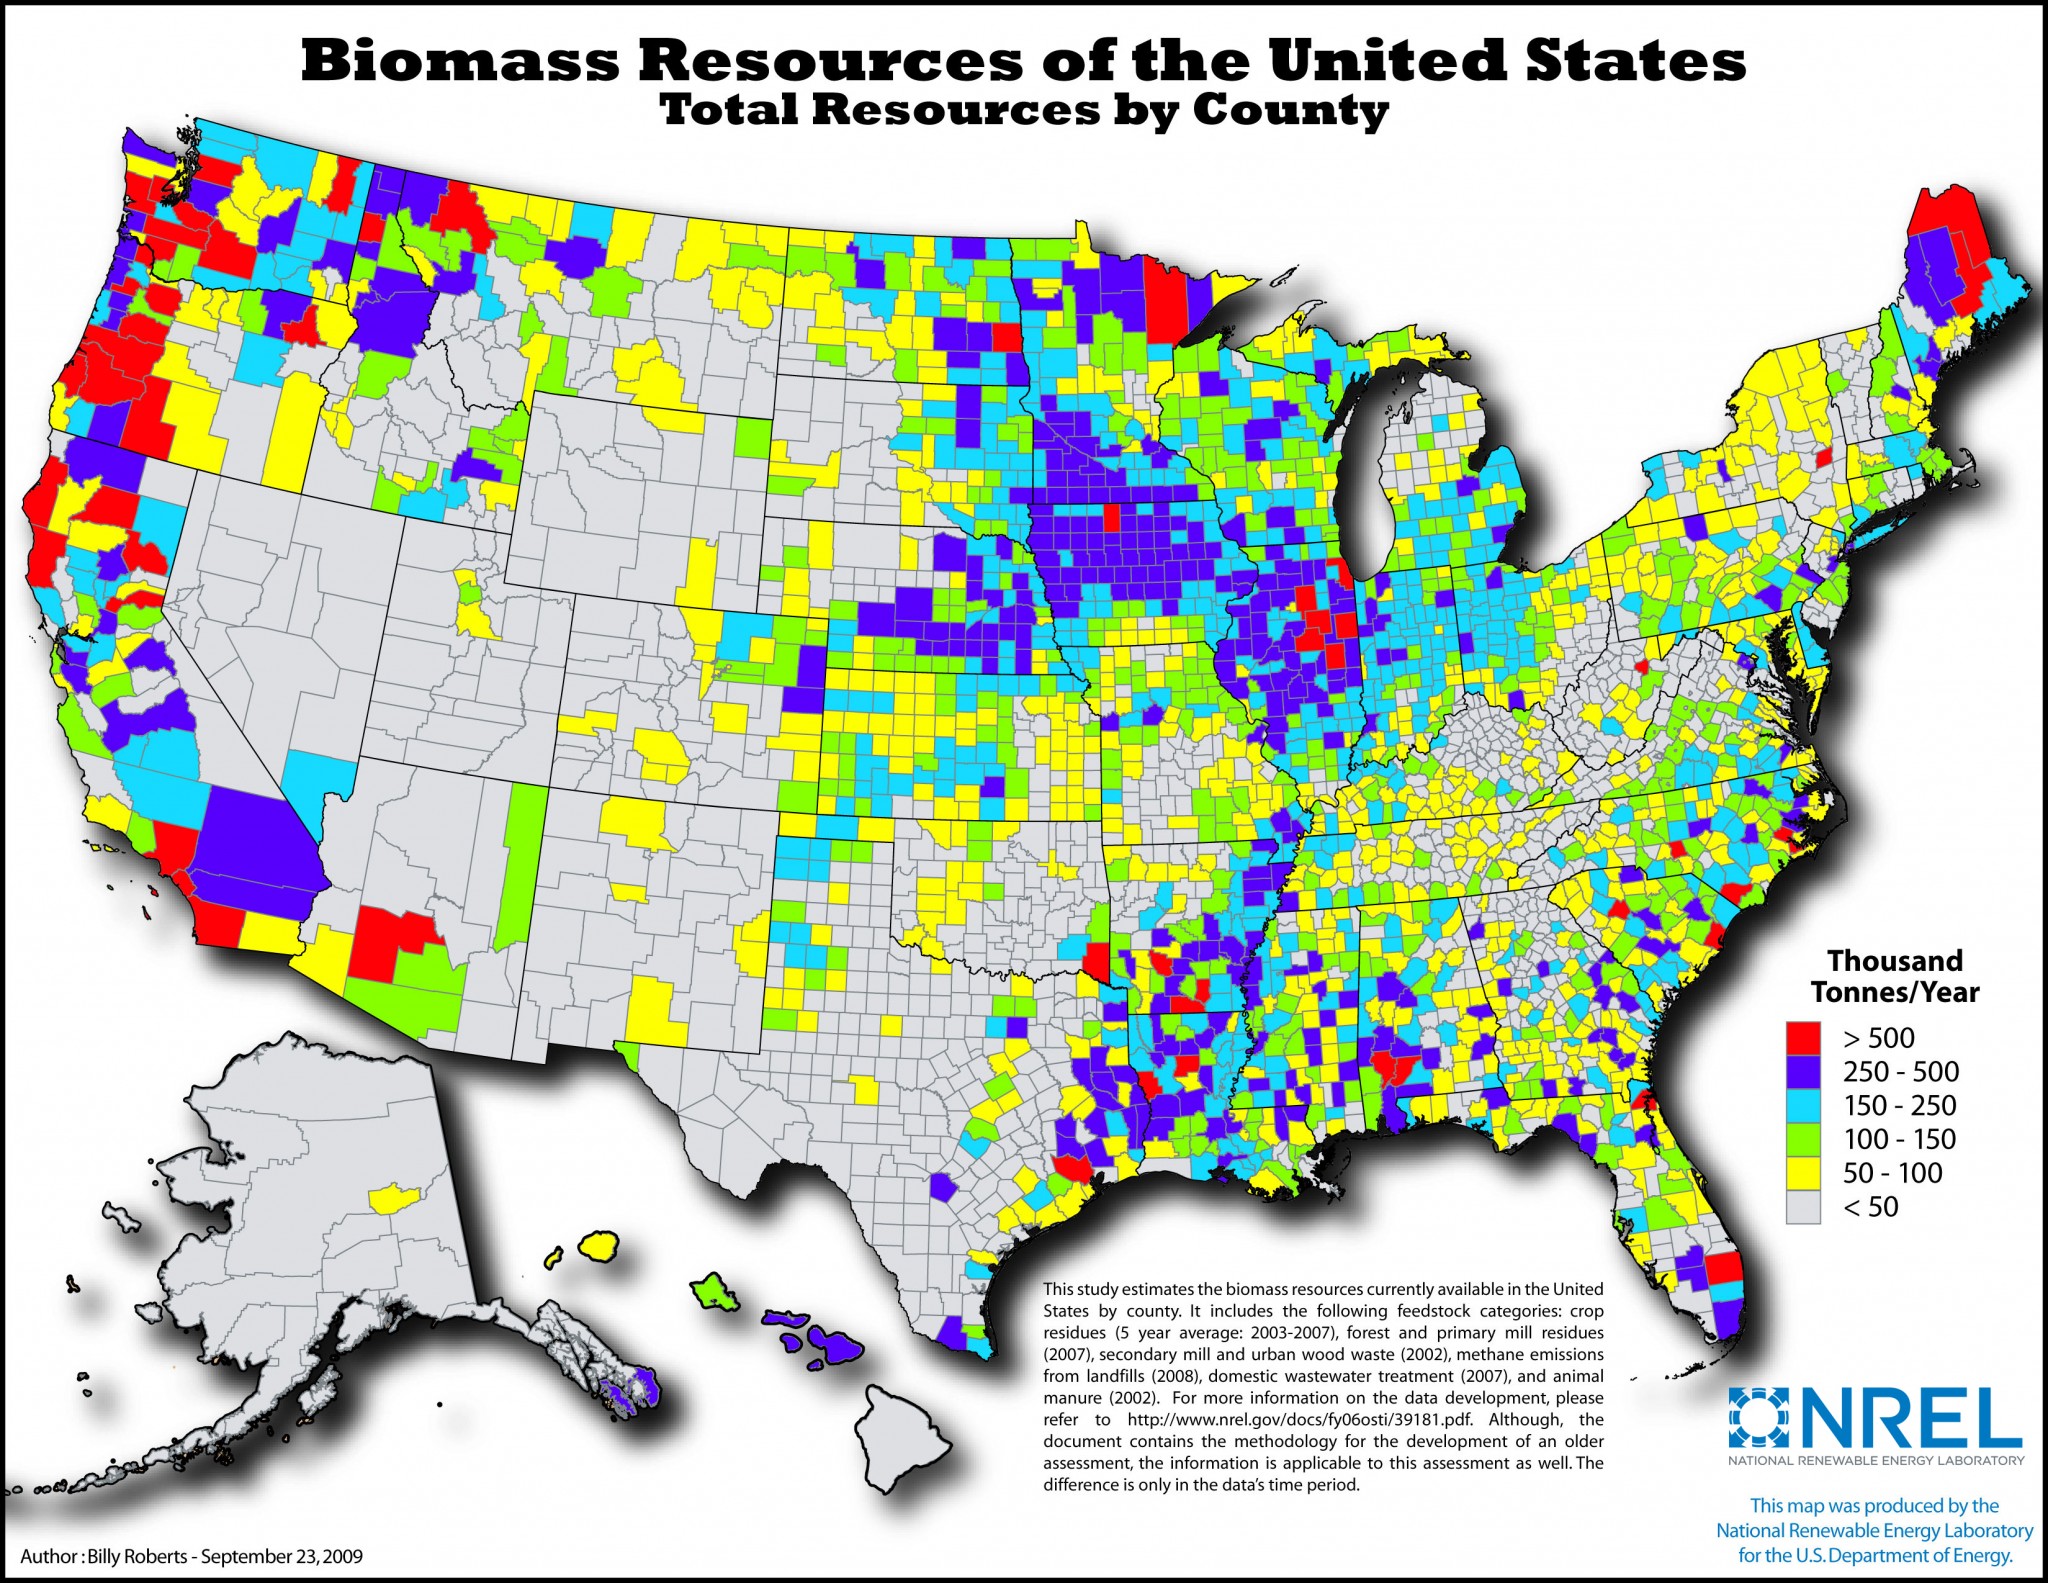
Biomass Resources of the USSubmitted by alyssablack on Tue, 07/15/2014 - 4:23pm Source: http://www.nrel.gov/gis/images/map_biomass_total_us_new.jpgImage: A map showing the biomass potential of the US by county. Note that San Diego's potential is high.Image Type: MapGeographic Area: United StatesCategory: 100renewablesandiegoYear: 2009Level: National
Known Geothermal Areas in CaliforniaSubmitted by alyssablack on Tue, 07/15/2014 - 4:19pm Source: http://www.energy.ca.gov/maps/renewable/geothermal_areas.htmlImage: A map showing the already known geothermal locations in California.Image Type: MapGeographic Area: CaliforniaCategory: 100renewablesandiegoYear: 2005Level: State
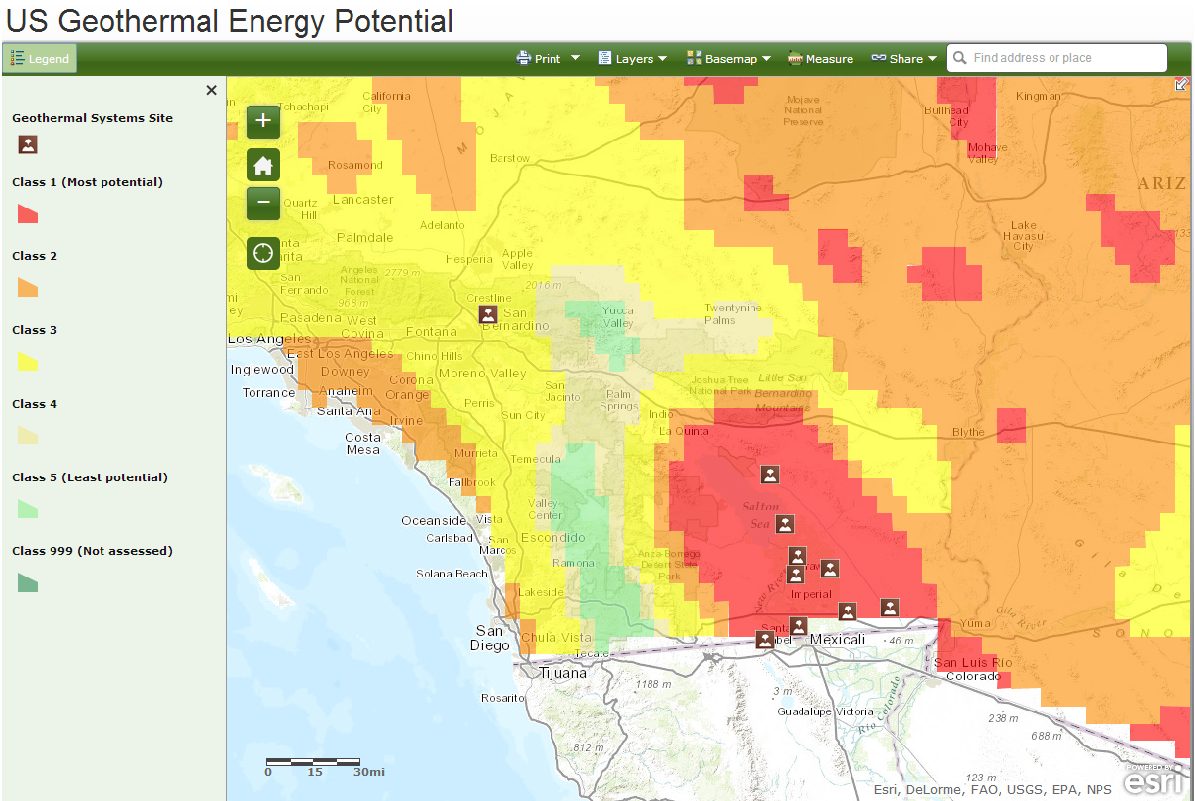
Geothermal Energy PotentialSubmitted by alyssablack on Tue, 07/15/2014 - 4:17pm Source: http://www.arcgis.com/apps/OnePane/basicviewer/index.html?appid=8e6c6c5837b9465a86541c5d3b054756Image: A map showing that the geothermal potential for San Diego is relatively high.Image Type: MapCategory: 100renewablesandiegoLevel: RegionalGeographic Area: Southern California
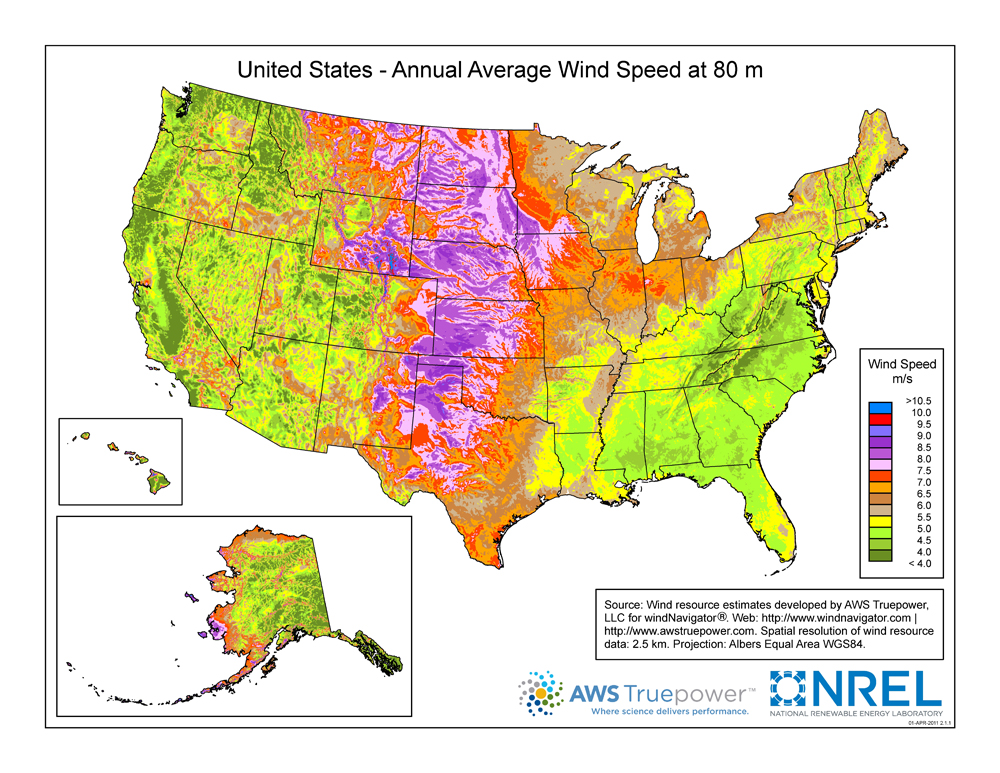
US Wind Speed MapSubmitted by alyssablack on Tue, 07/15/2014 - 4:11pm Source: http://apps2.eere.energy.gov/wind/windexchange/wind_maps.aspImage: A map showing the wind speeds all over America. Focusing on San Diego, it can be seen that for most of the county wind speeds are not very high.Image Type: MapGeographic Area: United StatesCategory: 100renewablesandiegoYear: 2011Level: National