

Facebook Posts
$ Mushroom Cultivation Workshop [Escondido]
Submitted by SimCenter Feed ... on
Presentation Video
Submitted by aashishrathi on
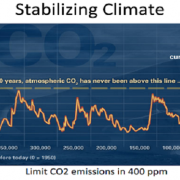
Can We Mobilize Fast Enough
Submitted by aashishrathi on
Can We Mobilize Fast Enough
Associated Media
 Presentation
- Video Presentation
Pages
Feeding Eight Billion People Well
Submitted by aashishrathi on

Presentation Video
Submitted by aashishrathi on
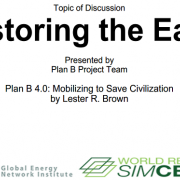
Restoring the Earth
Submitted by aashishrathi on
Restoring the Earth
Associated Media
 Presentation
- Video Presentation