INTRODUCTION
The World Resources Simulation Center (WRSC) will be a non-profit visualization facility where you can literally “see” the critical trends of global and regional issues, the relationships between issues, and the consequences of different strategies. For detailed information, begin by downloading the proposal documents to learn more about the specifics of the project. Next, explore several quick demonstrations of new technologies and how data and mapping information can be utilized in powerful new ways.
Then, we invite you to register your interest, and we’ll keep you updated on our progress. We are actively seeking partners, expertise and investment for the project.
THE WORLD RESOURCES SIMULATION CENTER

A large format, immersive visualization and simulation facility, the WRSC will compile an inventory of world resources, analyze and assess historical and projected trends, and study best practices and solutions to current and anticipated problems. The WRSC will provide global leaders from business, governments, education and NGOs a resource for cooperation and collaboration to make informed and sustainable choices for humanity as a whole in the shortest possible time. In our world of multiple crises, this kind of visualization tool is critical for thoughtful decision-making.
The WRSC will take advantage of current and evolving technologies which allow us to gather and turn data into accessible information, layered and displayed as 4-D map projections, to conduct geospatial analysis, to explore, visualize and create sophisticated optimal predictions that add insight and certainty to decision making. This visualization and simulation infrastructure provides access to in-depth, networked, globally distributed data on world resources, global trends and conditions.
VISUALIZATION TECHNOLOGY
As a proof of concept, the GENI Global Visualization was designed to show the potential uses of layered global environmental data. By choosing just two sets of data to overlay visually, relationships between them begin to emerge. The Flash Version of the visualization allows for a quick demonstration of the concept, while the WMS (Web Map Service) Version is a more powerful and complex tool. Follow either link to explore the project.
WMS Version |

EXPLORE OTHER VISUALIZATION TECHNOLOGIES ON THE WEB
There is no scarcity of thoughtful, knowledgeable, committed people working to make the world a better place. Below are a few demonstrations using visualization to explain environmental issues and trends. The WRSC will provide a large scale format to examine these and other issues, beyond the confines of a small computer screen.
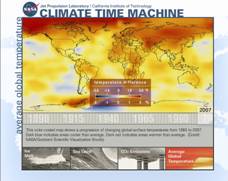 | Climate Time Machine |
 | GENI Renewable Energy Resource Maps Here you will find renewable energy resource maps (global/ continent wide/ country) with definitions, information and links to current articles as well as related web resources. |
 | Gapminder Explore this changing world using the best statistics on health, income, environment and much more. |
NEW TECHNOLOGY DEMONSTRATIONS
Cutting edge touch screens, immersive environments and mapping software are combining to give never before possible interactions between people and information. The WRSC will utilize these and other advancing technologies, allowing users to discover solutions in ways never before imagined.
This video shows researchers working on a | Duke University Graduate Student Gil Bohrer has |
Autodesk Design on Jeff Han’s Perceptive Pixel | Using Google Earth on a Multi-Touch Screen. |
WRSC Thirty Second Promo For updates, expressions of interest, or for more information about how to participate, please register here. The WRSC is a project of Our thanks to the Quantum Learning Network www.qln.com for hosting the WRSC Design event Copyright 2009 | |