Chart/Table

Annual economic loss from natural disasters as a percentage of GDP

Source: 

http://forum.maplecroft.com/showpage?section=cartograms&topic=cartogram_of_nat_dis_eco_loss_percent_GDP

Image: 

Annual economic loss from natural disasters as a percentage of GDP

The grafic shows the economic impacts for different countries. Even so that a lot of disasters hit the US the economic loss is insignificant. South Americas well as the Asian Regions, Africa and India are far more vulnerable for such events.

Level: 

Image Type: 

Category: 

The world’s costliest natural disasters in terms of economi losses since 1965

Source: 

http://www.poormojo.org/pmjadaily/archives/034402.php

Image: 

The world’s costliest natural disasters in terms of economi losses since 1965

Earthquake and Tsunami in Japan 2011 on the first place with a total damage of about 230 billion dollars. Equal cost damage of natural disaster have different impacts on economies depending on their economic power (GDP)!

Level: 

Image Type: 

Category: 

Natural Disasters frequency and costs from 1980 to 2010

Source: 

http://www.newscientist.com/article/mg21328474.200-last-year-costliest-on-record-for-natural-disasters.html

Image: 

Natural Disasters frequency and costs from 1980 to 2010

The frequency and the costs of natural disaster, which are linked to the climate change are constantly increasing (storms, extreme temperature, droughts, floods...) . The global loss reached 375 billion dollars in 2011, which equals about 0.5% of the global world product.

Level: 

Image Type: 

Category: 

Billion dollar weather disasters 1980-2011 in the US

Source: 

http://www.washingtonpost.com/blogs/capital-weather-gang/post/2011-ties-record-for-most-billion-dollar-weather-disasters/2011/07/26/gIQAvMd7aI_blog.html

Image: 

Billion dollar weather disasters 1980-2011 in the US

As well as the number as the damage amounts increased in the last 30 year. Reaching a total damage of 200 billion dollars in 2011 (about 1.3% of the US gross domestic product)

Image Type: 

Category: 

Level: 

Geographic Area: 

Trends in global water use by sector

Source: 

http://www.grida.no/publications/vg/water2/page/3229.aspx

Image: 

Trends in global water use by sector

the increased use of water is truly impressive, and the difference between consumption and Withdrawal will increase over time. The agricultural sector is the sector that consumes the most water today and probably in the future.

Level: 

Image Type: 

Category: 

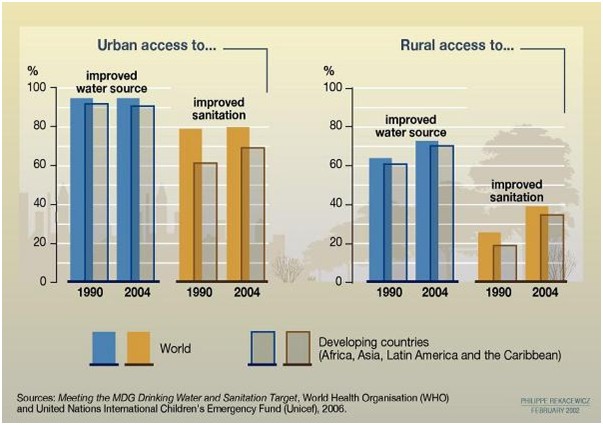
water access

Source: 

http://www.grida.no/graphic.aspx?f=series/vg-water2/0215-5-graph-regions-EN.jpg

Image: 

water access


Level: 

Image Type: 

Category: 

real time world statistics

Source: 

http://www.worldometers.info/

Image: 

real time world statistics


Worldometers is run by an international team of developers, researchers, and volunteers with the goal of making world statistics available in a thought-provoking and time relevant format to a wide audience around the world. We have no political, governmental, or corporate affiliation

Level: 

Image Type: 

Category: 

Defense against default

Source: 

http://www.spiegel.de/fotostrecke/graphics-gallery-the-most-important-facts-about-the-global-debt-crisis-fotostrecke-71636-4.html

Image: 

Defense against default

Defense against default for European Union

Image Type: 

Category: 

Level: 

Geographic Area: 

Tax Lost

Source: 

http://eoin-clarke.blogspot.com/2011/11/tax-justice-network-show-that.html

Image: 

Tax Lost

Graph of tax Lost by the shadow economy according to Tax Network Justice

Level: 

Image Type: 

Category: 

Pages