Finance and Investments

History of Crisis

Source: 

https://www.historyshots.com/FinancialCrisis/index.cfm

Image: 

History of Crisis

This graphic is based on the New York Times and Wall Street Journal best seller This Time Is Different: Eight Centuries of Financial Folly by Carmen M. Reinhart & Kenneth S. Rogoff. Using data developed by Reinhart and Rogoff, it maps the cyclical history of financial crisis from 1810 to 2010 for sixty-six countries representing 90% of world GDP.


Level: 

Image Type: 

Category: 

Tax Lost

Source: 

http://eoin-clarke.blogspot.com/2011/11/tax-justice-network-show-that.html

Image: 

Tax Lost

Graph of tax Lost by the shadow economy according to Tax Network Justice

Level: 

Image Type: 

Category: 

GDP projections to 2050

Source: 

http://www.guardian.co.uk/news/datablog/2011/jan/07/gdp-projections-china-us-uk-brazil

Image: 

GDP projections to 2050

this picture shows the GDP projections to 2050 and how the rankings change.

Level: 

Image Type: 

Category: 

GDP density World Map

Source: 

http://www.econbrowser.com/archives/2007/01/the_distributio.html

Image: 

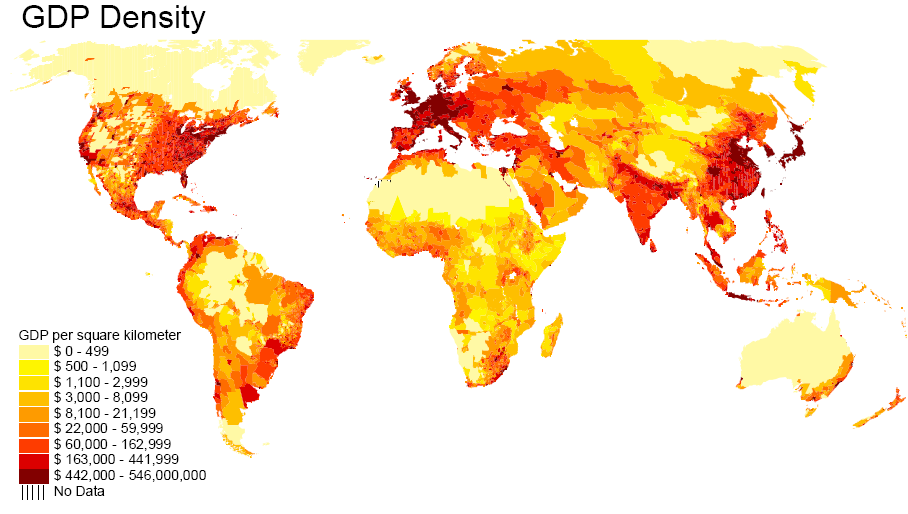
GDP density World Map

World Map with the density of GDP per Square Kilometer

Level: 

Image Type: 

Category: 

U.S government debt exceeds entire Euro zone and U.K combined

Source: 

http://www.google.com/imgres?um=1&hl=en&client=firefox-a&sa=N&rls=org.mozilla:en-US:official&biw=932&bih=658&tbm=isch&tbnid=Ra3080BNgHpwaM:&imgrefurl=http://www.whatamimissinghere.com/archives/41725/us-government-debt-exceeds-entire-euro-zone-and-uk-combined-graph&docid=c7eqoA-shq1RFM&imgurl=http://www.whatamimissinghere.com/wp-content/uploads/2012/04/US-Government-Debt-Exceeds-Entire-Euro-Zone-and-UK-Combined-Graph.jpg&w=500&h=363&ei=FuUiUOb_C8mriAK8wYCQDg&zoom=1

Image: 

U.S government debt exceeds entire Euro zone and U.K combined

The U.S debt topped $15 trillion in 2011; while the U.K and Euro zone's collective debt amounted to approximately $13 trillion.

Level: 

Image Type: 

Category: 

Pages